Graphing Variables
SCS allows for displaying 2D graphs of any variable in the simulation.
- To create a new empty graph, click on the
New Graphbutton under the graphs section at the bottom of the GUI window. - To add a variable to a graph, first select it in the variables tab by left-clicking it, then middle-click on the new empty graph.
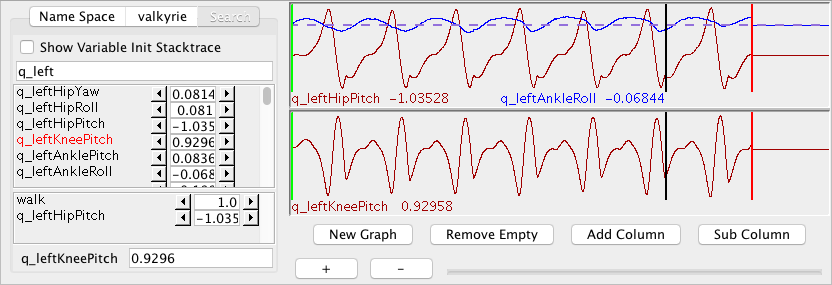
Go ahead and add q_leftHipPitch (the pitch angle of the robot's left hip) to the empty graph. This will graph q_leftHipPitch from buffered data. If you have not run the sim or do not see any data, run the sim now. Each graph can contain up to 4 variables.
Create some more new graphs, choose some more variables and place them in the graphs. Note that as more graphs are created, the others get smaller to accommodate them.

- The name and current value of each variable is underneath the graph it appears in.
- To remove a variable from a graph, middle click its name or right-click the graph and select it from the context menu.
- Note that if you remove all the variables from a graph, it will be empty but not disappear. If you wish to remove the empty graphs, click on the
Remove Emptybutton. - Click on the
Add Columnbutton to increase the number of graph columns. Click on theSub Columnbutton to remove the number of graph columns.
Graph Properties
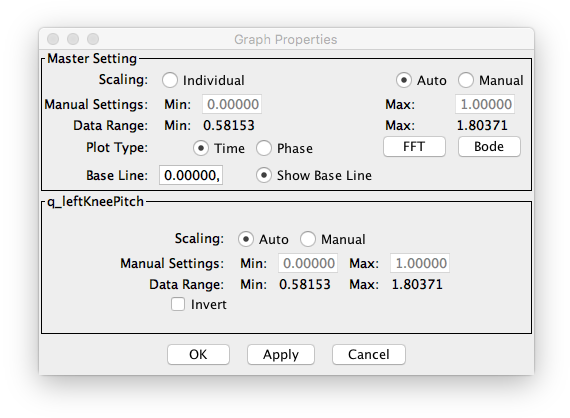
Double click on a variable name in one of the graphs. A Graph Properties Dialog Box will appear.

- This box will show which variables in the graph are set to Auto Scale. This means that when graphed, a variable will be plotted such that it vertically fills the graph, with the minimum value touching the bottom of the graph and the maximum value touching the top of the graph.
- Change to Manual scaling by clicking on the Manual radio button. Notice that the manual settings are now enabled. The default values are 0.0 minimum and 1.0 maximum. The data range is listed on the bottom. Change the minimum and maximum values. Graph the variable if it isn't already (middle click in an open graph) and note that the variable is plotted with the new data range.
- Double click on a graph containing two variables and change the plot type from 'Time' to 'Phase'. The first variable will now be the x-axis, with the second variable the y-axis.
Manipulating the Graph
- Zoom in on the data in a graph by going to
Graphs->Zoom Inon the menu or by pushing the toolbar Zoom In button . Push it a couple more times to zoom in further. Notice that zooming tends to center the data on the black line that marks the current index.
 - Zoom out by going to
Graphs->Zoom Outon the menu or by pushing the Zoom Out button . Zoom in and out until a few cycles of data fit the screen.
 - "Scrub" the data by left clicking on the data and dragging the mouse left and right. Notice that this moves the black line marking the current index. As you move the index, both the 3D graphics of the robot and the variable values in the variable panels will update.
- To "Step" forward through the data, one point at a time, either go to
Run->Step Forwardon the menu, push the Step Forward button or push the right arrow key on your keyboard after clicking in the graph.
 - To "Step" backward through the data, one point at a time, either go to
Run->Step Backwardon the menu, push the Step Backward button , or push the left arrow key on your keyboard after clicking in the graph.
 - "Pan" the data by first zooming into a section and then clicking on the data with the right mouse button and dragging left and right. This will move the data that you are zoomed into.
New Graph Window
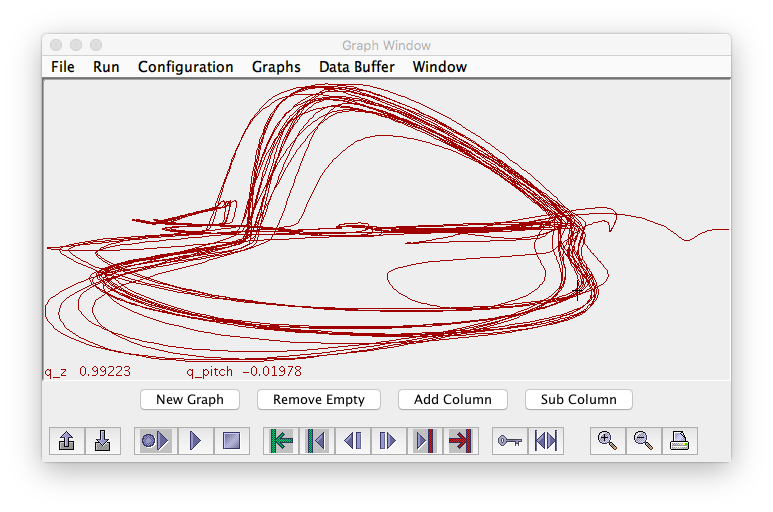
Go to Window->New Graph Window to create a new window for graphs. The new graph window operates similarly to the graphs on the main window. Here is an example of two variables in phase plot mode in a new Graph Window.

